利用JS绘制一个动态表格,高亮表格并连线
2025-4-2 1347 0
基于需要画一个线路图的需求,由于本人只会一些古老的JS,因此考虑使用表格实现这个功能。
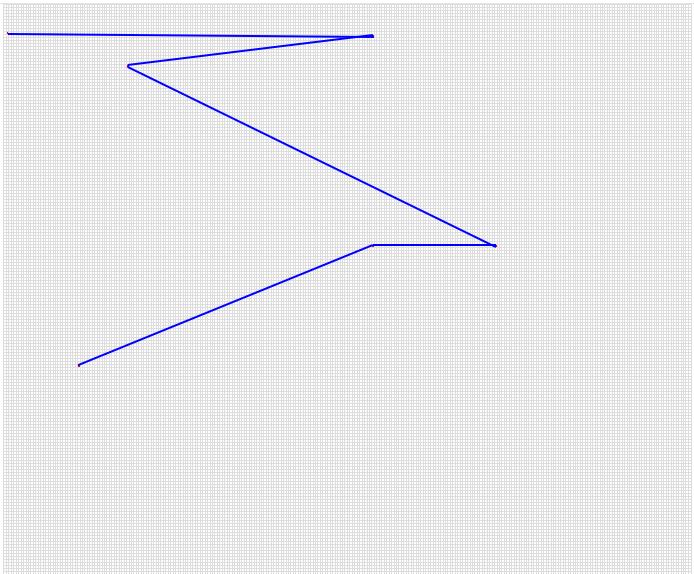
首先动态绘制一个固定行和列的表格,然后给每个单元格赋予一个ID,增加一个点击的监听事件,当收到点击事件时,把当前背景样式改为红色,并进行连线。

首先看图1

可以看到,绘制的表格已经均匀绘制满了屏幕的一块固定区域,然后点击某个单元格,会高亮该点,并且绘图。
但是这样很丑,正常我们会赋予一个底图,把表格的边缘隐藏,修改样式后,如图2

参考代码如下:
<!DOCTYPE html>
<html>
<head>
    <meta charset="UTF-8">
    <meta name="viewport" content="width=device-width, initial-scale=1.0">
    <title>高亮点击单元格并画线</title>
    <style>
        body, html {
            height: 100%;
            margin: 0;
            overflow: hidden;
        }
        .table-container {
            height: 90%;
            width: 70%;
            margin: auto;
            overflow: hidden;
            position: relative;
        }
        table {
            border-collapse: collapse;
            width: 100%;
            height: 100%;
            table-layout: fixed;
position: absolute;
border: none;
background-color: transparent;
/* 下面两行,设置背景图片并让它平铺,拉伸图片覆盖整个表格*/
background: url('demo.jpg');
background-size: cover;
        }
        td {
            /* border: 1px solid #ddd;*/
/* 下面两行的修改,为实现隐藏单元格的效果*/
            border: none;
background-color: transparent;
text-align: center;
            vertical-align: middle;
            overflow: hidden;
            white-space: nowrap;
        }
        .trajectory-line {
            position: absolute;
            background-color: blue;
            z-index: 1;
            height: 2px;
        }
        @media screen and (orientation: landscape) {
            td {
                height: calc(100% / 200);
                width: calc(100% / 200);
            }
        }
        @media screen and (orientation: portrait) {
            td {
                height: calc(80vh / 200);
                width: calc(70vw / 200);
            }
        }
    </style>
</head>
<body>

<div>
    <table>
        <script>
            const table = document.querySelector("table");
            const tableContainer = document.querySelector(".table-container");
            let highlightedCells = [];
            let trajectoryLines = [];

// 画一个固定的单元格
            for (let i = 0; i < 200; i++) {
                const row = document.createElement('tr');
                for (let j = 0; j < 280; j++) {
                    const cell = document.createElement('td');
                    cell.id = `${i}_${j}`;
                    cell.addEventListener('click', function() {
                        const currentColor = window.getComputedStyle(this).backgroundColor;
                        const isRed = currentColor.toLowerCase() === 'rgb(255, 0, 0)'
                                        || currentColor.toLowerCase() === 'red';
                        if (isRed) {
                            this.style.backgroundColor = '';
                            removeHighlight(this);
                        } else {
                            this.style.backgroundColor = 'red';
                            highlightedCells.push(this);
                            if (highlightedCells.length > 1) {
                                drawTrajectory();
                            }
                        }
                    });
                    row.appendChild(cell);
                }
                table.appendChild(row);
            }

            function removeHighlight(cell) {
                const index = highlightedCells.indexOf(cell);
                if (index > -1) {
                    highlightedCells.splice(index, 1);
                }
                trajectoryLines.forEach(line => line.remove());
                trajectoryLines = [];
                drawTrajectory();
            }

// 把高亮的单元格,画线
            function drawTrajectory() {
trajectoryLines.forEach(line => line.remove());
trajectoryLines = [];

// 获取容器相对视口的位置(含滚动偏移)
const containerRect = tableContainer.getBoundingClientRect();

highlightedCells.forEach((cell, index) => {
if (index === highlightedCells.length - 1) return;

const nextCell = highlightedCells[index + 1];
const cellRect = cell.getBoundingClientRect();
const nextRect = nextCell.getBoundingClientRect();

// 计算单元格中心点(相对容器)
const startX = cellRect.left + cellRect.width/2 - containerRect.left;
const startY = cellRect.top + cellRect.height/2 - containerRect.top;
const endX = nextRect.left + nextRect.width/2 - containerRect.left;
const endY = nextRect.top + nextRect.height/2 - containerRect.top;

// 计算向量差值(关键修正点)
const deltaX = endX - startX;
const deltaY = endY - startY;

// 创建轨迹线元素
const line = document.createElement('div');
line.className = 'trajectory-line';

// 关键属性设置(修正旋转中心)
line.style.position = 'absolute';
line.style.transformOrigin = 'left top'; // 以起点为旋转中心
line.style.left = `${startX}px`;
line.style.top = `${startY}px`;

// 计算角度和长度(使用向量差值)
const length = Math.sqrt(deltaX*deltaX + deltaY*deltaY);
const angle = Math.atan2(deltaY, deltaX) * 180 / Math.PI;

line.style.width = `${length}px`;
line.style.transform = `rotate(${angle}deg)`;
line.style.height = '2px';
line.style.backgroundColor = 'blue';
line.style.zIndex = 1;

tableContainer.appendChild(line);
trajectoryLines.push(line);
});
}

            function highlightInitialCells() {
                const cellsToHighlight = [
                    {row: 9, column: 1},
                    {row: 10, column: 150},
                    {row: 20, column: 50},
                    {row: 80, column: 200},
{row: 80, column: 150},
                    {row: 120, column: 30}
                ];
                cellsToHighlight.forEach(cell => {
                    const cellId = `${cell.row}_${cell.column}`;
                    const element = document.getElementById(cellId);
                    if (element) {
                        element.style.backgroundColor = 'red';
                        highlightedCells.push(element);
                    }
                });
                if (highlightedCells.length > 1) {
                    drawTrajectory();
                }
            }

            window.onload = function() {
                highlightInitialCells();
            };
        </script>
    </table>
</div>

</body>
</html>
具体是显示图片还是单元格,可以在table和td的样式处就行调整。